How America Saves
- Said Israilov
- Jul 14, 2025
- 7 min read
Updated: Aug 4, 2025

Each year, Vanguard publishes How America Saves, a detailed report on how millions of Americans are saving and investing in their workplace retirement plans. It shares insights on contribution rates, investment choices, and account balances, helping investors understand trends and best practices in retirement readiness.
When it comes to your retirement nest egg, it’s natural to wonder how you stack up against your peers. Vanguard’s How America Saves 2025 gives you a clear, data-backed snapshot of how nearly 5 million Americans are saving for retirement, broken down by age, income, gender, and job tenure. By comparing your own savings rate and balances with people in your cohort, you can see where you’re on track and where you might need to adjust to build a more secure retirement. It’s a practical way to turn curiosity into action for your future.
In this weekend reading article, we will explore key trends from the report together. To make it more relatable, we will follow two hypothetical investors, 👨💻 Josh and 👩💼 Hanna.
👨💻 Josh is a 28 year old software engineer in San Francisco who earns $140,000. He has $35,000 in retirement savings, defers 5 percent of his pay, and keeps 80 percent of his portfolio in equities.
👩💼 Hanna is a 42 year old marketing executive in Chicago who earns $190,000. She has $120,000 in retirement savings, defers 11 percent of her pay, and also keeps 60 percent of her portfolio in equities.
Now let us look at how more than 5 million workplace savers across the United States invest and contribute toward their future.
Account balances
Average balances rose sharply in 2024: The average account balance for Vanguard participants increased to $148,153 (up 10% from 2023), while the median balance rose to $38,176 (up 8%), reflecting strong market returns (13.7% participant total return) and ongoing contributions.
Median vs. average highlights inequality: The large gap between average and median balances is driven by a small number of very large accounts; nearly 3 in 10 participants have under $10,000 saved, while another 3 in 10 have over $100,000, and 16% have over $250,000.
Balances reflect only partial preparedness: Vanguard account balances indicate how much participants have saved at a specific employer, but they do not capture lifetime retirement savings since participants may roll over, cash out, or move accounts when changing jobs.

Account balances by participant demographics
Income & Job Tenure: Higher income and longer job tenure strongly correlate with higher retirement account balances, as participants earning $150,000+ and those with 10+ years tenure have average balances over $300,000, reflecting higher contribution rates and consistent participation over time.
Age: Retirement balances increase with age, peaking for those 65+, who have nearly 43 times the savings of those under 25 on average, illustrating the compounding effect of long-term saving and the typical progression of earnings and contributions throughout a career.
Gender: Male participants have average and median balances about 30% higher than females, reflecting income and participation differences; however, when controlling for income, the gap narrows, with women saving at similar rates within income bands.


👨💻 Josh and 👩💼 Hanna. Looking at their retirement savings accumulation, we see two different trajectories:
Josh sits below his age group average with $35,000 saved, though he's still ahead of half his peers (median $16,255). At 28, he has time to close this gap, but needs to accelerate his savings rate to reach typical benchmarks for his income level and career stage.
Hanna demonstrates the power of consistent saving with $120,000 accumulated, positioning her above her peer average of $103,552. Her savings reflect both higher income and likely more years of steady contributions, showing how career progression and saving discipline compound over time.
Employee deferrals
Steady increase in deferral rates: Vanguard participants saved an average of 7.7% of their income in 2024 (up from 6.9% in 2015), reflecting a gradual, consistent increase in employee deferral rates over the past six years despite economic turbulence.
Half of participants save below 6.8%: The median deferral rate in 2024 was 6.8%, meaning half of participants save less, highlighting the importance of personalized contribution planning for long-term adequacy.
Most participants increased their contributions: In 2024, 45% of participants raised their deferral rates (via auto-escalation or manually), while only 8% decreased them and 2% stopped contributing, indicating positive momentum toward retirement preparedness.

Employee deferral rates by participant demographics
Deferral rates rise with age and tenure: In 2024, employees aged 55–64 deferred an average of 9.3% of income, nearly double the 5.5% rate of those under 25, while employees with 10+ years of tenure deferred 9.1% on average, reflecting higher contributions with age and career stability.
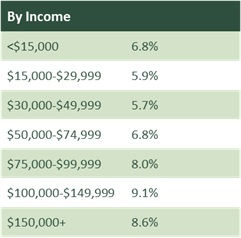
Higher incomes correlate with higher savings rates: Participants earning $150,000+ deferred 8.6% of income on average in 2024, while those earning less than $15,000 deferred 6.8%, highlighting the impact of income on the ability to contribute more consistently toward retirement.
Balances influence deferral rates: Participants with balances over $250,000 deferred at the highest average rate (11.0%) in 2024, while those with balances under $10,000 deferred just 4.1%, emphasizing the reinforcing cycle of higher savings and higher account growth over time.


👨💻 Josh and 👩💼 Hanna. Their deferral rates reveal contrasting approaches to retirement funding:
Josh's 5% deferral rate falls short of both the median (6.8%) and his age group average, representing a missed opportunity for tax-advantaged growth. Even a modest increase to 7-8% could significantly impact his long-term outcomes while he's early in his career.
Hanna exemplifies aggressive saving with her 11% deferral rate, substantially exceeding her age group (7.3%) and high-earner averages (8.6%). This disciplined approach directly correlates with her above-average account balance and positions her well for retirement security.
Investment allocation
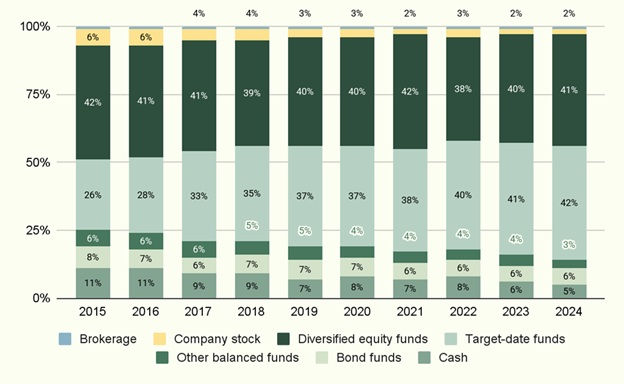
Equity allocations continue to rise: In 2024, 75% of Vanguard plan assets were invested in equities, reflecting a gradual increase over the past decade as participants adopt more growth oriented allocations within their retirement plans.
Target date funds drive balanced investing: Balanced strategies now account for 45% of assets (42% in target date funds), reshaping participant behavior by promoting age appropriate equity exposure while reducing extreme allocation swings in portfolios.
Equity allocation declines with age: Younger participants maintain high equity allocations (87 to 88%), while those 70+ drop to 45%, reflecting a clear, downward sloping allocation pattern aligned with age and retirement proximity.
Target date funds drive age appropriate investing: The widespread use of target date funds and managed account advice is leading to more age appropriate equity exposure, reducing extreme allocations and smoothing the transition to lower equity exposure as participants age.
Shift from hump shaped to declining pattern: Unlike in 2005 when middle aged participants held the highest equity exposure, 2024 data shows a consistent decline in equity allocation with age, indicating changing participant behavior and plan design due to auto enrollment and default investments.

Average equity allocation, participant weighted

Investment allocation by participant demographic


Equity allocations by age (2024)

👨💻 Josh and 👩💼 Hanna. Their investment approaches reveal distinctly different philosophies toward risk and growth:
Josh's 80% equity allocation aligns well with his age group average (88%), demonstrating an appropriate growth oriented strategy for someone with 35+ years until retirement. When looking at diversified equity fund allocation specifically, his approach significantly exceeds the typical 24% average for his demographic, showing he's maximizing growth potential through concentrated equity exposure.
Hanna's 60% equity allocation falls below her age group average (84%), reflecting a more conservative investment philosophy despite her strong saving discipline. Her approach also outweighs the diversified equity fund average for her age group (32%), but represents a more balanced strategy that prioritizes stability alongside growth.
Their contrasting approaches demonstrate that successful retirement planning can accommodate different risk tolerances, though both benefit from understanding how their choices compare to age appropriate benchmarks and long term wealth building potential.
What This Means for Your Financial Journey
Whether you're saving 4% or 14%, the most important step is consistent progress. If you found yourself below the median for your age group, consider this your friendly reminder that small increases, even 1% annually, compound significantly over time.
Questions about how your situation compares, or wondering if your investment mix aligns with your goals? Join our Nomad Finance Telegram community where we discuss these trends weekly, or reach out directly. We're here to help you navigate these decisions with confidence.
Want to dive deeper? We offer comprehensive financial planning that goes beyond the benchmarks to build strategies tailored to your specific goals and circumstances. To learn more about our services, book a discovery call.
More Weekend Reads
If you enjoyed diving into retirement savings data, you might find these recent Weekend Read articles helpful for your financial planning journey:
Never Bet Against America (July 4, 2025) - Why long-term investing in American markets has historically rewarded patient investors, despite short-term volatility and economic uncertainty.
5 Reasons Not to Convert to a Roth (June 30, 2025) - Before jumping on the Roth conversion trend, consider these scenarios where traditional retirement accounts might serve you better.
401(k) Loans: When They Help and When They Hurt (June 13, 2025) - The strategic uses and hidden costs of borrowing from your retirement account, plus alternatives to consider first.
Rent vs. Buy: Which Makes Financial Sense for You? (June 6, 2025) - Beyond the emotional factors, here's how to run the numbers on one of the biggest financial decisions you'll make.
IMPORTANT DISCLAIMERS
Past performance is no guarantee of future returns
The graphs and charts in this commentary are for illustrative purposes only and not indicative of any actual investment. Index returns do not reflect any fees, expenses, or sales charges. It is not possible to invest directly in an index. Stocks are not guaranteed and have been more volatile than other asset classes. Historical returns were the result of certain market factors and events which may not be repeated in the future. Financial professionals are responsible for evaluating investment risks independently and for exercising independent judgement in determining whether investments are appropriate for clients.
This material is intended for information purposes only, and does not constitute investment advice, a recommendation or an offer or solicitation to purchase or sell any securities.
Disclaimer: Investments are not guaranteed and are subject to investment risk, including possible loss of the principal amount invested. Past performance is no guarantee of future results. All allocations and opinions expressed are as of the date of this presentation and subject to change. The information contained herein does not constitute investment advice or a solicitation. Information obtained from 3rd parties is believed to be accurate, but has not been independently verified.
The opinions expressed in this article are for general informational purposes only and are not intended to provide specific advice or recommendations for any individual or on any specific security. The material is presented solely for information purposes and has been gathered from sources believed to be reliable, however Israilov Financial LLC cannot guarantee the accuracy or completeness of such information, and certain information presented here may have been condensed or summarized from its original source. Israilov Financial LLC does not provide tax or legal advice, and nothing contained in these materials should be taken as such.
As always, please remember investing involves risk and possible loss of principal capital. Advisory services are only offered to clients or prospective clients where Israilov Financial LLC and its representatives are properly licensed or exempt from licensure. No advice may be rendered by Israilov Financial LLC unless a client service agreement is in place.


Comments